
Advertisement
Mole Valley District Council
Map of the Mole Valley Council Area
The area shaded blue on the map represents the extent of Mole Valley Council. The map pin represents the location of the council offices.
Waste Recycling Performance
19 (5.51%) of local authorities perform better than Mole Valley Council.
325 (94.20%) of local authorities perform worse than Mole Valley Council.
Mole Valley Council has a population of 82,000.
Mole Valley District Council is within the ceremonial county of Surrey
click to enlarge
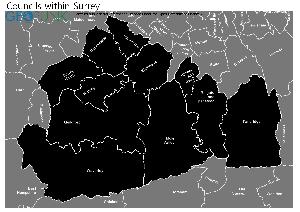
Download Print Quality PDF of Councils in Surrey
Councils Neighbouring Mole Valley Council
Wards within Mole Valley District Council
click to enlarge

- Ashtead Common
- Ashtead Park
- Ashtead Village
- Beare Green
- Bookham North
- Bookham South
- Box Hill and Headley
- Brockham, Betchworth and Buckland
- Capel, Leigh and Newdigate
- Charlwood
- Dorking North
- Dorking South
- Fetcham East
- Fetcham West
- Holmwoods
- Leatherhead North
- Leatherhead South
- Leith Hill
- Mickleham, Westhumble and Pixham
- Okewood
- Westcott
Download Print Quality PDF of Wards in Mole Valley District Council
Mole Valley Council Contact Details
| Website | http://www.molevalley.gov.uk/ |
| Contact Us Page | http://www.molevalley.gov.uk/index.cfm?articleid=17697 |
| Address | Pippbrook |
| Town | Dorking |
| County | Surrey |
| Postcode | RH4 1SJ |
| Telephone Number Description | Main reception |
| Telephone Number | 01306 885 001 |
| Fax Number | 01306 876 821 |
| Main Contact Email | info@molevalley.gov.uk |
Details for Mole Valley District Council
| Local Authority Name | Mole Valley District Council |
| SNAC Code | 43UE |
| Postcode | RH4 1SJ |
| Latitude | 51.2356022742 |
| Longitude | -0.325318108276 |
| Country | England |
| NHS Health Authority | South East Coast |
| Parliamentary Constituency | Mole Valley |
| European Electoral Region | South East |
| Primary Care Trust | Surrey |
| Region | South East |
| Admin County | Surrey |
| ONS Code | E07000210 |
Political Make Up of Mole Valley Council
| Type | LC |
|---|---|
| Party with Overall Control | LD |
| Labour | 0 |
| Liberal Democrats | 24 |
| Conservative Party | 9 |
| Green Party | 1 |
| UK Independence Party | 0 |
| Plaid Cymru - The Party of Wales | 0 |
| Scottish National Party | 0 |
| Democratic Unionist Party | 0 |
| Sinn Féin | 0 |
| Ulster Unionist Party | 0 |
| Social Democratic and Labour Party | 0 |
| Traditional Unionist Voice | 0 |
| Progressive Unionist Party | 0 |
| Independent | 7 |
| Vacant | 0 |
| Electoral Cycle Start Date | 2016 |
| Electoral Cycle End Date | 2030 |
2022 Election Results for Mole Valley Council
| Council Seats up for Election | Third |
|---|---|
| Labour | 0 |
| Liberal Democrats | 24 |
| Green Party | 0 |
| Conservatives | 10 |
| Others | 7 |
| Vacant Seats | 0 |
Waste and Recycling Rates for Mole Valley Council 2017-18
Waste Recycling Performance
19 (5.51%) of local authorities perform better than Mole Valley Council.
325 (94.20%) of local authorities perform worse than Mole Valley Council.

| Authority Type | Collection |
|---|---|
| Waste per household KG | 369.2 |
| Percentage of household waste sent for reuse, recycling or composting | 57.90% |
| Collected household waste per person (kg) | 380.1 |
Employee Headcount for Mole Valley Council
FTE = Full Time Equivalent
| Region | South East |
|---|---|
| Total Headcount | 274 |
| Total FTE | 245 |
| Male Full Time | 99 |
| Female Full Time | 88 |
| Male Part Time | 15 |
| Female Part Time | 72 |
| Permanent | 274 |
| Temporary/Casual | 0 |
| Male | 114 |
| Female | 160 |
| Full-time | 187 |
| Part-Time | 87 |
| Male Full Time perm | 99 |
| Female Full Time perm | 88 |
| Perm Male | 114 |
| Perm Female | 160 |
| Perm Full-time | 187 |
| Perm Part-time | 87 |
| Male total FTE perm | 109 |
| Female total FTE perm | 136 |