
Advertisement
Norwich City Council
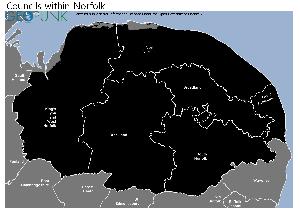
Map of the Norwich City Council Area
The area shaded blue on the map represents the extent of Norwich City Council. The map pin represents the location of the council offices.
Waste Recycling Performance
237 (68.90%) of local authorities perform better than Norwich City Council.
106 (30.81%) of local authorities perform worse than Norwich City Council.
Norwich City Council has a population of 135,800.
Norwich City Council is within the ceremonial county of Norfolk
click to enlarge
Download Print Quality PDF of Councils in Norfolk
Councils Neighbouring Norwich City Council
Wards within Norwich City Council
click to enlarge
.jpg)
- Bowthorpe
- Catton Grove
- Crome
- Eaton
- Lakenham
- Mancroft
- Mile Cross
- Nelson
- Sewell
- Thorpe Hamlet
- Town Close
- University
- Wensum
Download Print Quality PDF of Wards in Norwich City Council
Norwich City Council Contact Details
| Website | http://www.norwich.gov.uk/ |
| Contact Us Page | http://www.norwich.gov.uk/ContactUs/Pages/default.aspx |
| Address | City Hall |
| Town | Norwich |
| County | Norfolk |
| Postcode | NR2 1NH |
| Telephone Number | 0844 980 3333, 8am to 5pm |
| Fax Number | 01603 213 000 |
| Main Contact Email | info@norwich.gov.uk |
| Opening Hours | Monday, Tuesday, Thursday and Friday, 8.45am to 5pm, Wednesday 1pm to 5pm |
Details for Norwich City Council
| Local Authority Name | Norwich City Council |
| SNAC Code | 33UG |
| Postcode | NR2 1NH |
| Latitude | 52.6285718659 |
| Longitude | 1.29161482135 |
| Country | England |
| NHS Health Authority | East of England |
| Parliamentary Constituency | Norwich South |
| European Electoral Region | Eastern |
| Primary Care Trust | Norfolk |
| Region | East of England |
| Admin County | Norfolk |
| ONS Code | E07000148 |
Political Make Up of Norwich City Council
| Type | LC |
|---|---|
| Party with Overall Control | LAB |
| Labour | 25 |
| Liberal Democrats | 3 |
| Conservative Party | 0 |
| Green Party | 11 |
| UK Independence Party | 0 |
| Plaid Cymru - The Party of Wales | 0 |
| Scottish National Party | 0 |
| Democratic Unionist Party | 0 |
| Sinn Féin | 0 |
| Ulster Unionist Party | 0 |
| Social Democratic and Labour Party | 0 |
| Traditional Unionist Voice | 0 |
| Progressive Unionist Party | 0 |
| Independent | 0 |
| Vacant | 0 |
| Electoral Cycle Start Date | 2016 |
| Electoral Cycle End Date | 2030 |
2022 Election Results for Norwich City Council
| Council Seats up for Election | Third |
|---|---|
| Labour | 25 |
| Liberal Democrats | 3 |
| Green Party | 11 |
| Conservatives | 0 |
| Others | 0 |
| Vacant Seats | 0 |
Waste and Recycling Rates for Norwich City Council 2017-18
Waste Recycling Performance
237 (68.90%) of local authorities perform better than Norwich City Council.
106 (30.81%) of local authorities perform worse than Norwich City Council.

| Authority Type | Collection |
|---|---|
| Waste per household KG | 430.6 |
| Percentage of household waste sent for reuse, recycling or composting | 37.70% |
| Collected household waste per person (kg) | 322.4 |
Employee Headcount for Norwich City Council
FTE = Full Time Equivalent
| Region | East of England |
|---|---|
| Total Headcount | 625 |
| Total FTE | 542 |
| Male Full Time | 212 |
| Female Full Time | 184 |
| Male Part Time | 52 |
| Female Part Time | 177 |
| Permanent | 594 |
| Temporary/Casual | 31 |
| Male | 264 |
| Female | 361 |
| Full-time | 396 |
| Part-Time | 229 |
| Male Full Time perm | 200 |
| Female Full Time perm | 179 |
| Perm Male | 249 |
| Perm Female | 345 |
| Perm Full-time | 379 |
| Perm Part-time | 215 |
| Male total FTE perm | 233 |
| Female total FTE perm | 283 |
| Male Full Time temp | 12 |
| Female Full Time temp | 5 |
| Temp Male | 15 |
| Temp Female | 16 |
| Temp Full-time | 17 |
| Temp Part-time | 14 |
| Male total FTE temp | 14 |
| Female total FTE temp | 12 |